Introduction
This post is about health. Actually, its about a little project that implements a medical device called Uroflowmeter (not sure if that is the usual English word). Its a mouth full name to mean “little device that measures the flow of pee” (yes, pee as in urine 😇).
Last year I had to perform an exam called Uroflowmetry (nothing serious, a lot people do that exam). The doctor said that, as the name implies, I had to measure “how fast I pee”. Technically it measures the flow of urine that flows when you urinate. At the time I thought to myself: “How the heck will he do that?”. Maybe be it was using a very sophisticated device, I didn’t know. Then he explained to me that I had to pee in a special toilet hooked up to a computer. He showed me the special device and left the room (it would be difficult if he stayed and watched hehehehehe). I didn’t see any sign of ultra technology anywhere. Then, I got the result and was nothing serious.
The exam result is a plot of flow vs time. Figure 1 shows an example of such exam. Since my case was a simple one, the only thing that matted in that exam was the maximum value. So, for me, the result was a single number (but I still had to do the whole exam and get the whole plot).
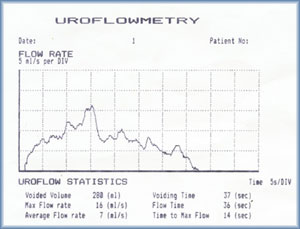
Figure 1 : Sample of a Uroflowmetry result[3]
Then, he prescribe a very common medicine to improve the results and told me that I would repeat the exam a couple of days later. After about 4 or 5 days I returned to the second exam. I repeated the whole process and peed on the USD $10,000.00 toilet. This time I did’t feel I did my “average” performance. I guess some times you are nervous, stressed or just not concentrated enough. So, as expected, the results were not ultra mega perfect. Long story short, the doctor acknowledge the result of the exam and conducted the rest of the visit (I’m fine, if you are wondering heheheh).
That exam got me thinking that it (the exam) did not capture the real “performance” of the act, by measuring only one flow. I might had notice some improvement with the medication, but I wasn’t so sure. So, how to be sure? Well, if only I could repeat the exam several times in several different situations… By doing that I could see the performance in average. I thought so seriously about that, that I asked the clinic how much does the exam costs. The lady in the desk said that it around $100,00 Brazil Reais ($30.00 USD, more or less in today’s rate). That was a bummer… The health insurance won’t simply pay lots of exams for me and if I were to make, say, 10 exams, it would cost me one thousand Brazil Reais. Besides, I would still have only 10 data points.
The project
Thinking about that, maybe I could measure it myself…? Then I decided to make my own “Urine flow meter”. it would be a Hardware / Software project, so I mediately though of using an Arduino (figure 2). The trick part is to measure the flow of something like urine. The solution I came up was to make an Arduino digital scale to measure the weight of the pee while I’m peeing on it (awkward or disgusting as it sounds %-). Then, I could measure the weight in real time at each, say, 20 to 50ms. Knowing the density of the fluid I’m testing I could compute the flow by differentiating the time measurement. Google told me that the density of urine is about 1.0025mg/l (if you are curious, its practically water actually). Later on I discovered that, that is exactly how some machine works, including the one I did the exams.
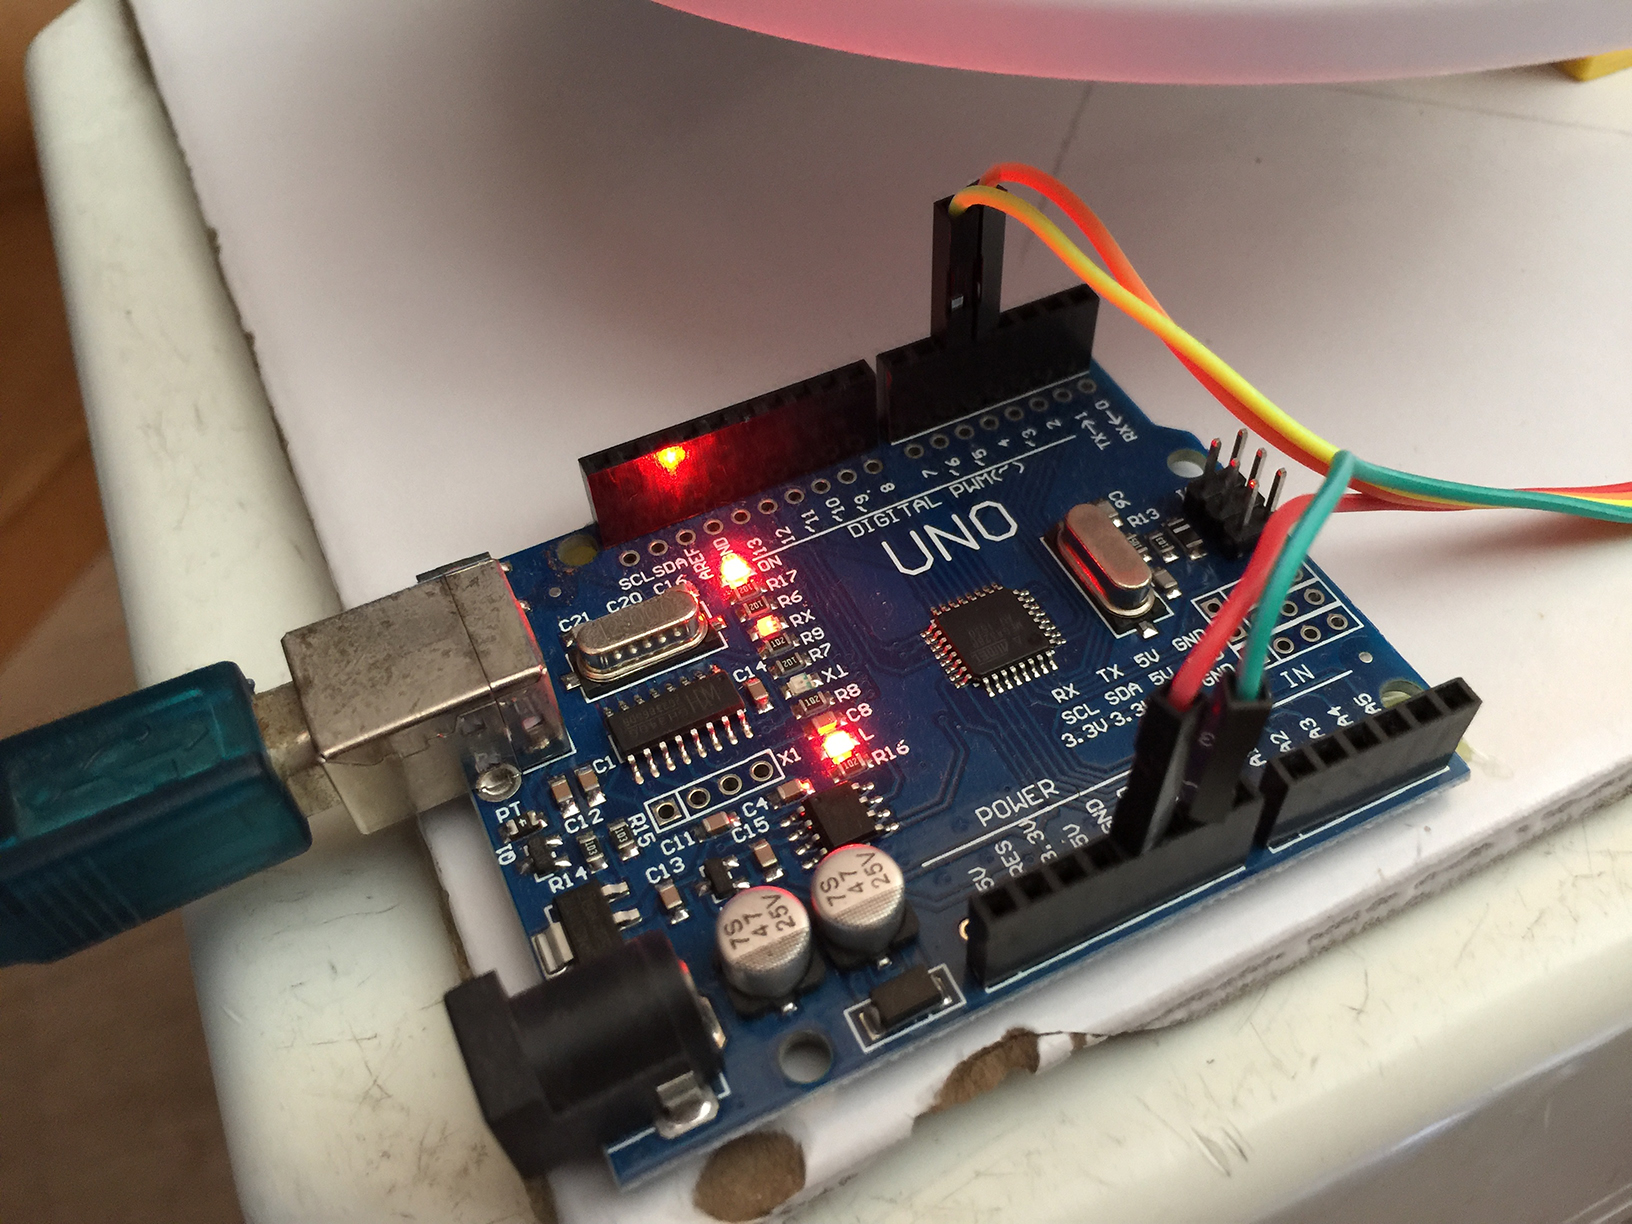
Figure 2 : Arduino board
First I had to make the digital scale, so I used a load cell that had the right range for this project. The weight of the urine would range from 0 to 300~500mg more or less, so I acquire a 2Kg range load cell (Figure 3 and 4). I disassemble an old kitchen scale to use the “plate” that had the right space to hold the load cell and 3D printed a support in a heavy base to avoid errors in the measurements due to the flexing of the base. For that, I used a heavy ceramic tile that worked very well. The cell “driver” was an Arduino library called HX711. There is a cool youtube tutorial showing how to use this library [1].
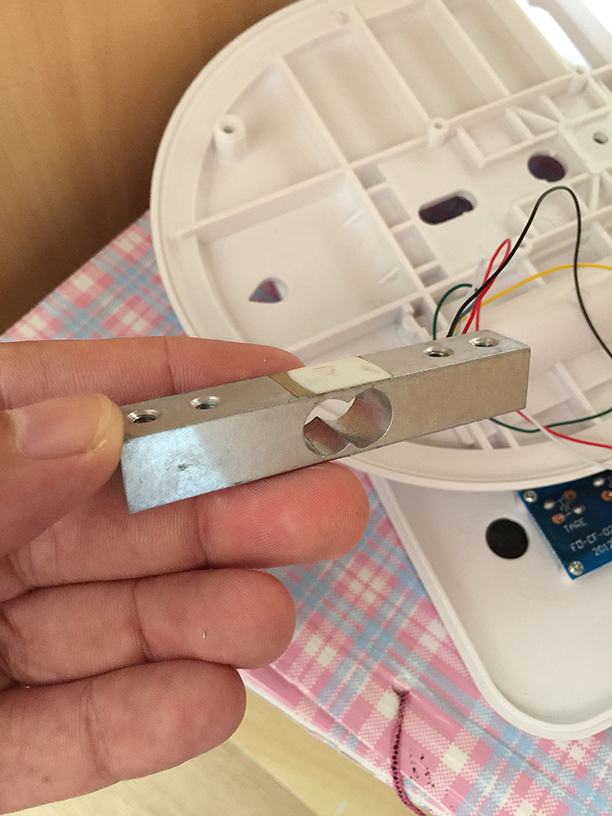
Figure 3 : Detail of the load cell used to make the digital scale.
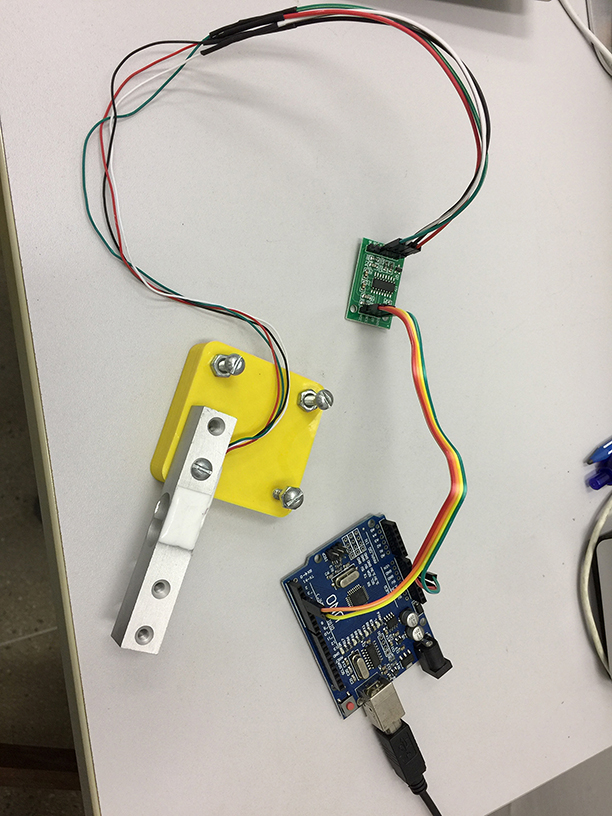
Figure 4 : Load cell connected to the driver HX711
The next problem was how to connect to the computer!!! This is not a regular project that you can assemble everything on your office and do tests. Remember that I had do pee on the hardware! I also didn’t want to bring a notebook to the bathroom every time I want to use it! the solution was to use a wifi module and communicate wirelessly. Figure 5 shows the module I used. Its an ESP8266. Now I could bring my prototype to the bathroom and pee on it while the data would be sent to the computer safely.
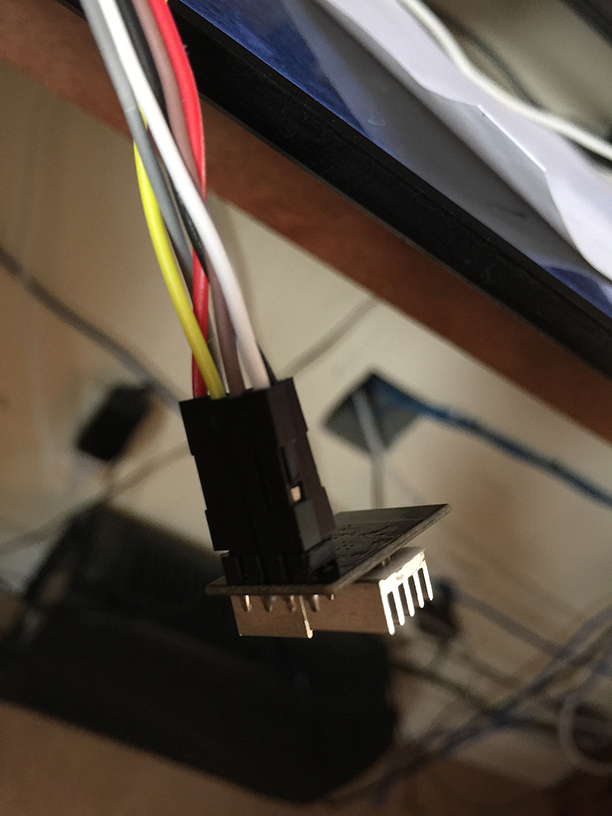
Figure 5 : ESP8266 connection to the Arduino board.
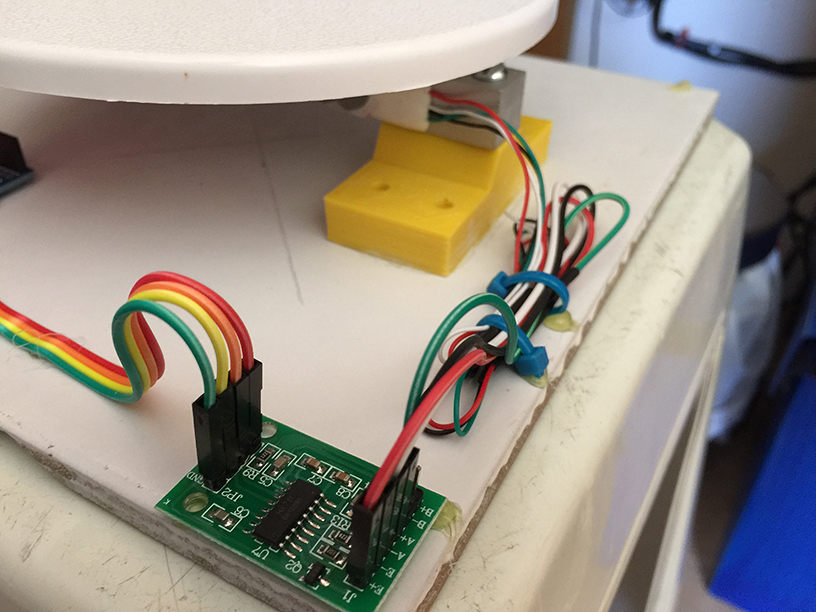
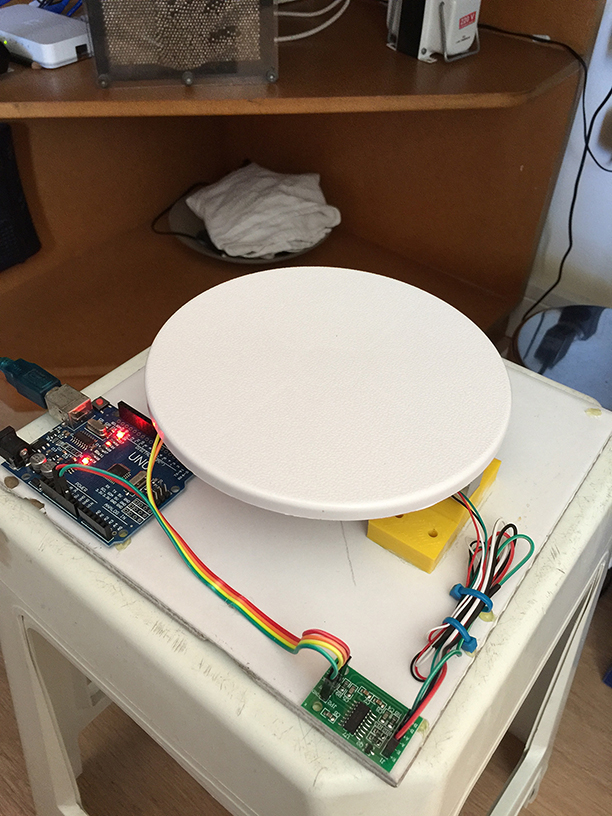
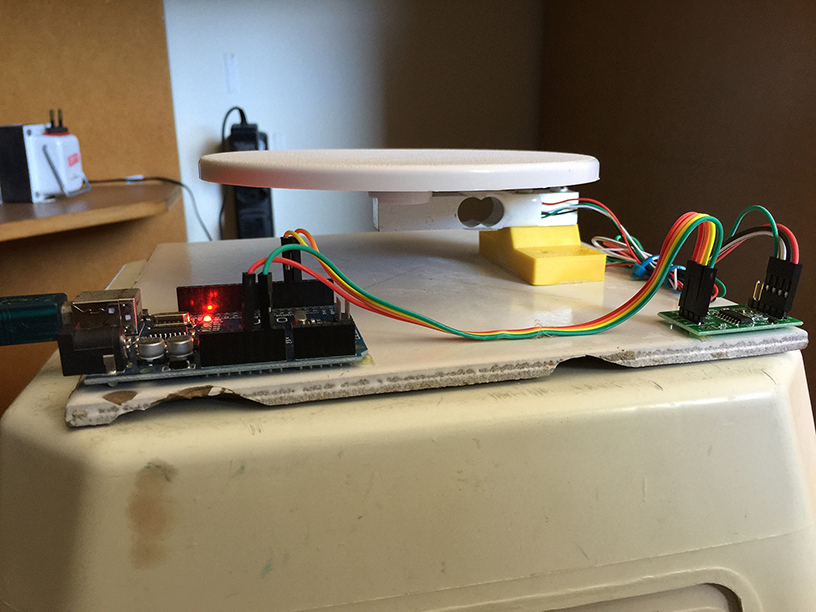
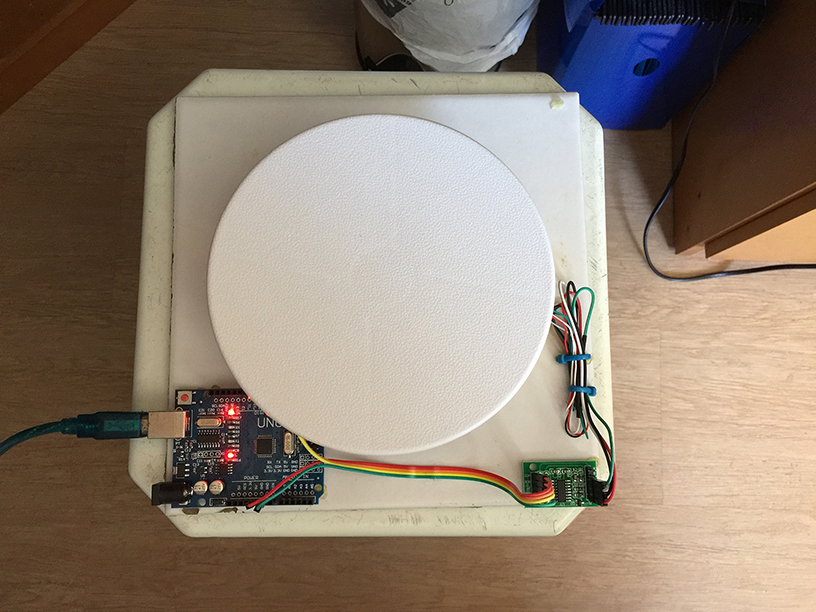
Figure 6 : More pictures of the prototype
Once built, I had to calibrate it very precisely. I did some tests to measure the sensibility of the scale. I used an old lock and a small ball bearing to calibrate the scale. I went to the laboratory of Metrology at my university and a very nice technician in the lab (I’m so sorry I forgot his name, but he as very very kind) measures the weights of the lock and the ball bearing in a precision scale. Then I started to do some tests (see video bellow)
The last thing to make the prototype 100% finished was to have a funnel that had the right size. So I 3D printed a custom size funnel I could use (figure 7).
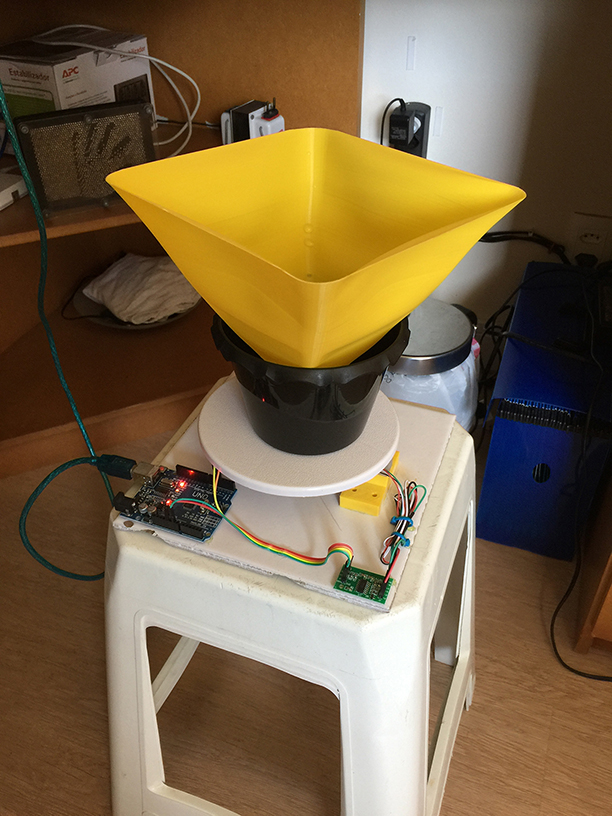
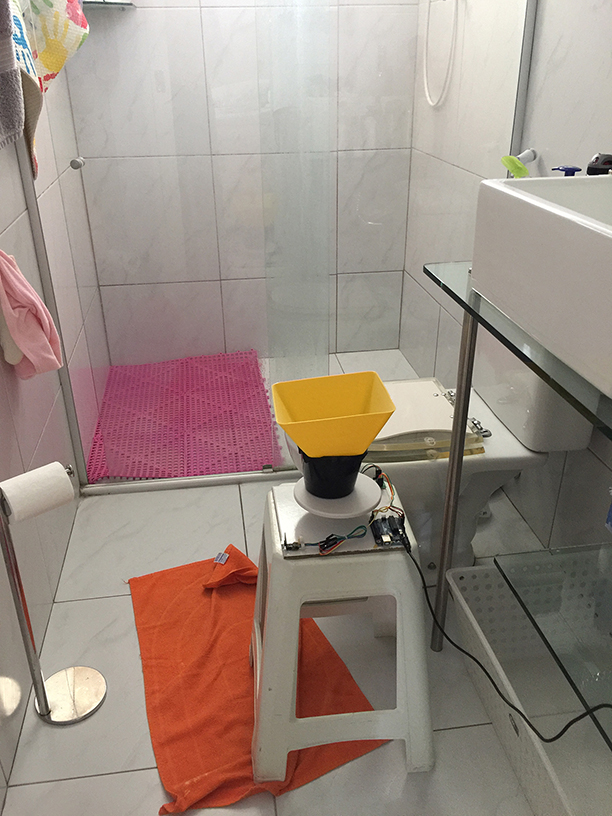
Figure 7: Final prototype ready to use
Once calibrated and ready to measure weights in real time, It was time to code the flow calculation. At first, this is a straight forward task, you just differentiate the measurements in time. Something like
![\[f[n] = \frac{{w[n - 1] - w[n]}}{{\rho \Delta t}}\]](https://www.dev-mind.blog/wp-content/ql-cache/quicklatex.com-a81c10b09d9b4c5bc1c4d73b7bf65648_l3.png "Rendered by QuickLaTeX.com")
Where ![f[n]](https://www.dev-mind.blog/wp-content/ql-cache/quicklatex.com-1479bec20a625c285db239d653030988_l3.png "Rendered by QuickLaTeX.com") and
and ![w[n]](https://www.dev-mind.blog/wp-content/ql-cache/quicklatex.com-d6e3136b03954fd1324599ad93edc716_l3.png "Rendered by QuickLaTeX.com") are the flow and weight at time
are the flow and weight at time  .
.  is the density and
  is the time between measurements.
Unfortunately, that simple procedure is not enough to generate the plot I was hoping for. That’s because the data has too much noise. But I teach DSP, so I guess I could do some processing right 😇? Well I took the opportunity to test several algorithms (they are all in the source code at GitHub[2]). I won’t dive into details here about each one. The important thing is that the noise was largely because of the differentiation process so I tested filtering before and after compute the differentiation. The method that seemed to give better results was the spline method. Basically I got the flow data and averaged  fitted downsampled data with a spline. One sample of the results can be seen in figure 8.
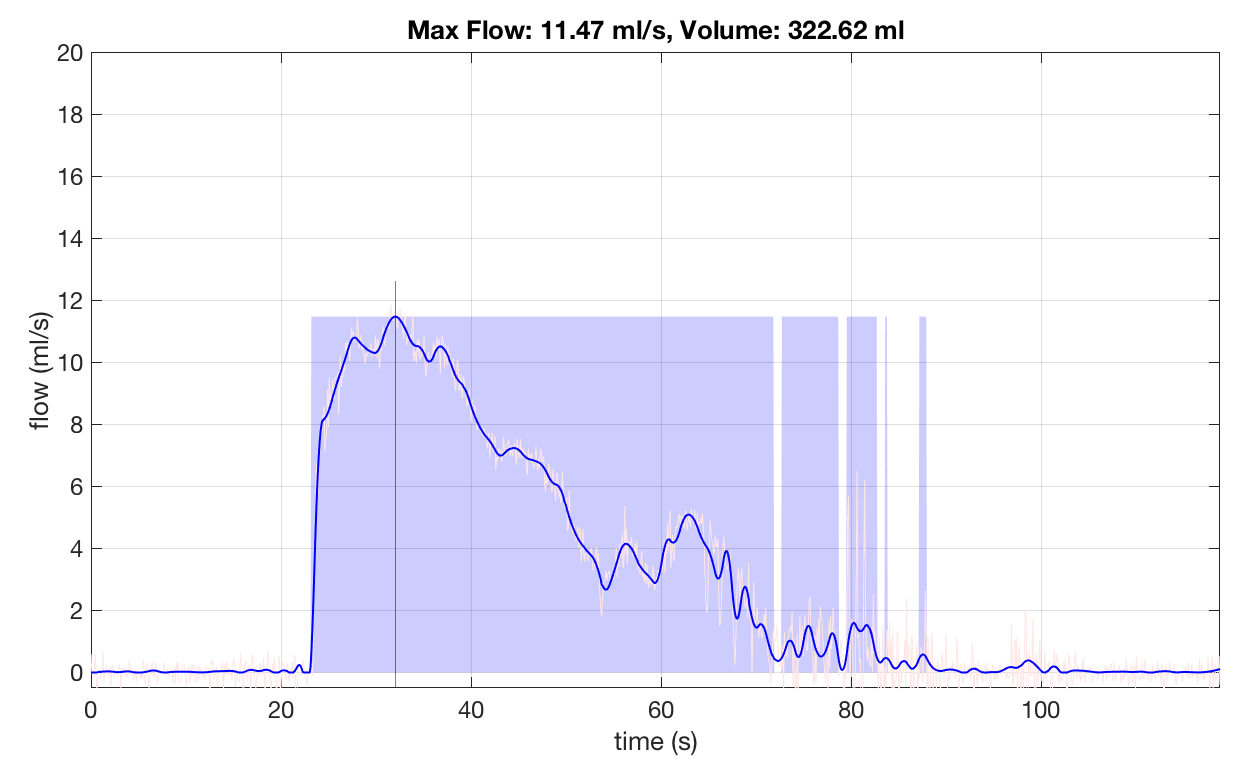
Figure 8 : Result of a typical exam done with the prototype.
The blue line is the filtered plot. The raw flow can be seen in light red. The black line tells where the max flow is and the blue regions estimates the non-zero flow (if you get several blue regions it means you stop peeing a lot in the same “go”). In the top of the plot you have the two numbers that the doctor is interested: The max flow and the total volume.
With everything working, it was time to use it! I spent 40 days using it and collected around 120 complete exams. Figure 9 shows all of them in one plot (just for the fun of it %-).
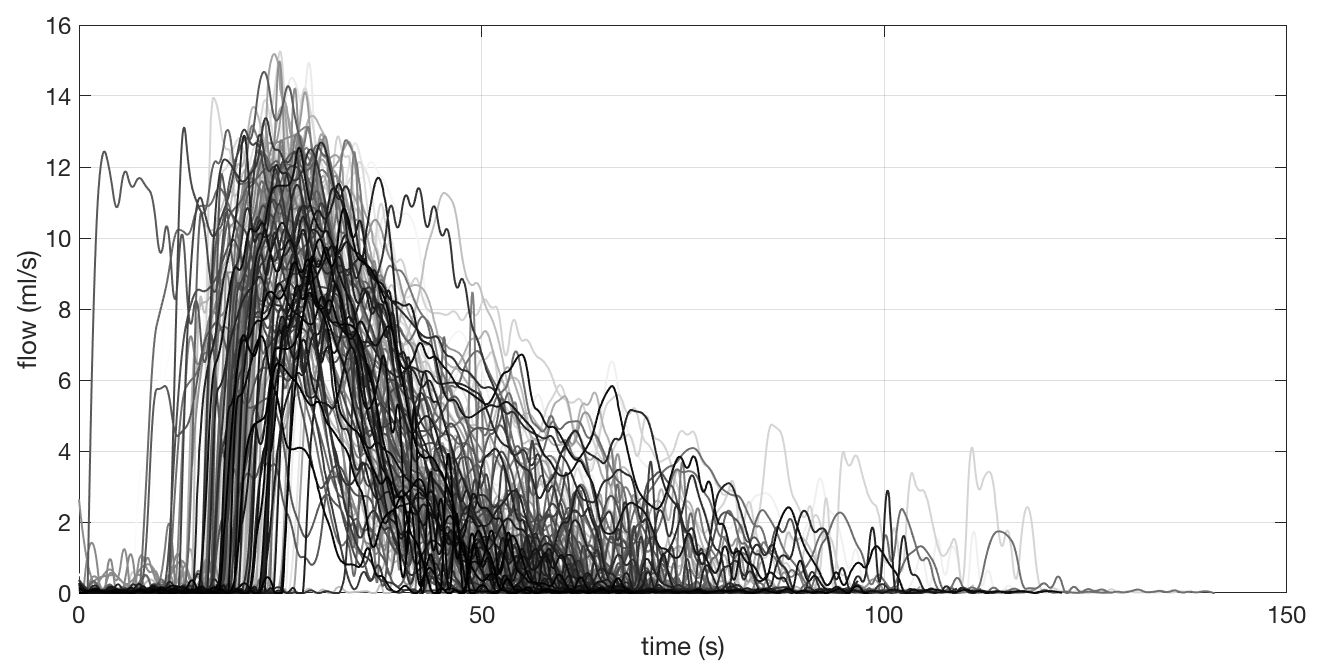
Figure 9 : 40 days of exams in one plot
Obviously, this plot is useless. To just show a lot of exams does not mean too much. Hence, what I did was to do the exams for some days without the medicine and then with the medicine. Then I separated only the max flow for each exam and plotted over time. Also, I computed the mean and the standard deviation for the points with and without the medicine and plotted in the same graph. The result is showed in figure 10.
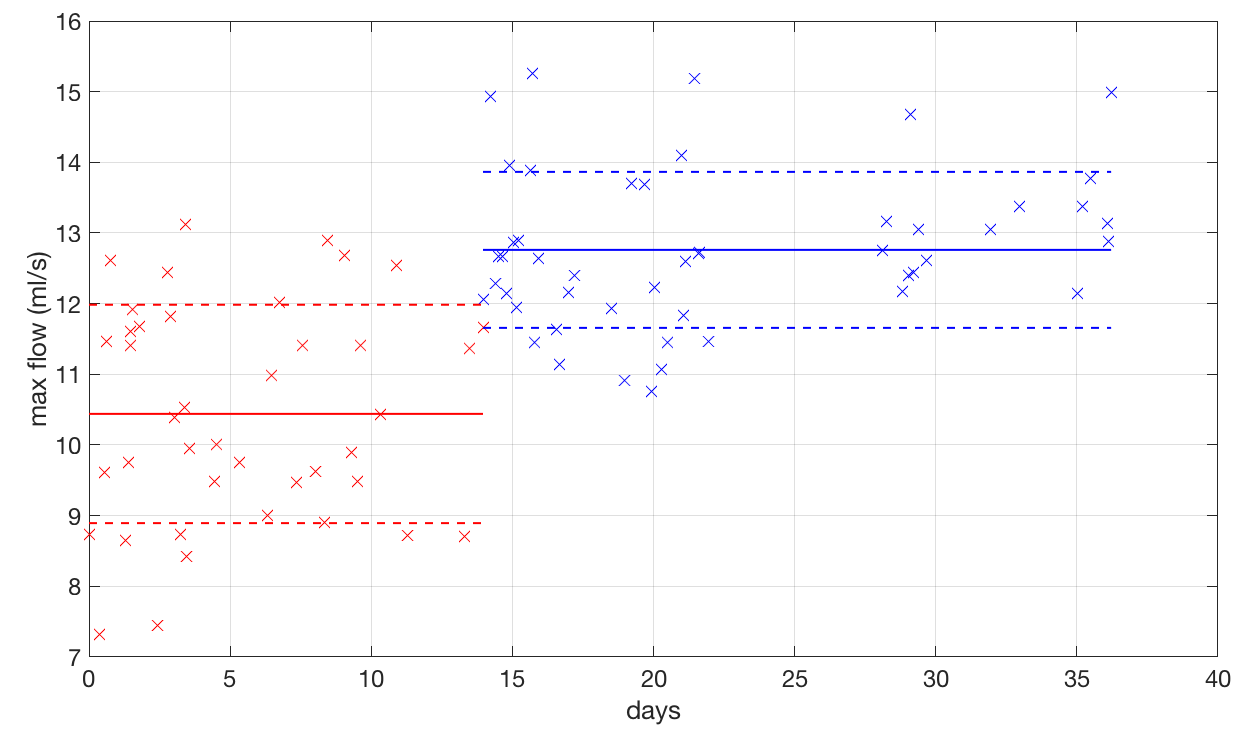
Figure 10 : Plot of max flow versus time. Red points are the results of max flow whiteout the medicine. The blue ones are the result with the medicine.
Well, as you can see, the medicine works a bit for me! The average for each situations is different and they are within more or less one standard deviation from each other. However, with this plot you can see that some times, even with the medicine, I got some low values… Those were the days I was not at my best for taking the water out of my knee. On the other hand, at some other days, even without the medicine, I was feeling like the bullet that killed Kennedy and got a good performance! In the end, statistically, I could prove that indeed the medicine was working.
Conclusions
I was very happy that I could do this little project. Of course that this results can’t be used as a definite medical asset. I’m not a physician, so I’m not qualified to take any action whatsoever based on those results. I’ll show it to my doctor and he will decide what to do with them. The message I would like to transmit with it to my audience (students, friend, etc) is that, what you learn at the university is not just “stuff to pass on the exams”. They are things that you learn that can help a lot if you really understand them. This project didn’t need any special magical skill! Arduino is simple to use, the sensor and the wifi ESP have libraries. The formula to compute flow from weight is straight forward. Even the simple signal filtering that I used (moving average) got good results for the max flow value. Hence, I encourage you, technology enthusiast to try things out! Use the knowledge that you acquired in your undergrad studies! Its not only useful, its fun! Who would have thought that, at some point in my life, I would pee on one of my projects!!! 😅
Thank you for reading this post. I hope you liked it and, as always, feel free to comment, give me feedback, or share if you like! See you in the next post!
References
[1] – Load cell
[2] – Urofluximeter GitHub
[3] – NIDHI Uroflow
dear friend (i dont know your name!)
basically, i had lot of surgeries in my urethra so i do the “uroflowmetry” lots of time.
i had notice that every time i do the test i don’t pee as good as i do at home.
that why i started to think to myself – can i build one?
then i found your article – it was very fun to read.
interesting that i am fourth year student for electrical engineering at israel.
so i am willing to do this project for me.
thank you very much.
is it ok to ask you question if i have?
also, how long did it take you build and code the prototype?
is it preferred to do it with arduino/raspberry pi? (i know to code in python)
i will be very happy to here from you
Hello there!
My name is Allan. Thank you for the comment on the post!
I would be very happy to answer any question you have (if I could, of course hehehe)!
The build didn’t take too long, its a simple project really… If you have an RPi I think its far easier because of the wifi and all the hight level stuff that you can do. I’m not sure how hard it is to interface the HX converter (for the scale) to the Rpi though, but I believe its simple via I2C.
Again thanks for the comments!